Monitor your own PC/laptop with Prometheus
Prometheus provides an exporter to help us monitor our machine or server. We can use that to monitor our own PC/laptop. The exporter is called node exporter. You can find the link to download the binary on the node exporter releases page. Select the latest relese and then download the tar gz file that suit your machine operating system and architecture. At the time of this writing, the latest version is 1.8.1. If you are using windows, you can use windows exporter instead of node exporter.
Once downloaded, extract the file.
$ tar xzvf node_exporter-1.8.1.darwin-arm64.tar.gzChange into the extracted directory and run the binary file.
$ cd node_exporter-1.8.1.darwin-arm64
$ ./node_exporter
Read the last line of the output messages. It shows the address that you can then open in your browser.
ts=2024-07-02T14:06:34.523Z caller=node_exporter.go:193 level=info msg="Starting node_exporter" version="(version=1.8.1, branch=HEAD, revision=400c3979931613db930ea035f39ce7b377cdbb5b)"
ts=2024-07-02T14:06:34.525Z caller=node_exporter.go:194 level=info msg="Build context" build_context="(go=go1.22.3, platform=darwin/arm64, user=root@0ed3c8b67453, date=20240521-18:39:09, tags=unknown)"
ts=2024-07-02T14:06:34.526Z caller=filesystem_common.go:111 level=info collector=filesystem msg="Parsed flag --collector.filesystem.mount-points-exclude" flag=^/(dev)($|/)
ts=2024-07-02T14:06:34.527Z caller=filesystem_common.go:113 level=info collector=filesystem msg="Parsed flag --collector.filesystem.fs-types-exclude" flag=^devfs$
ts=2024-07-02T14:06:34.527Z caller=node_exporter.go:111 level=info msg="Enabled collectors"
ts=2024-07-02T14:06:34.527Z caller=node_exporter.go:118 level=info collector=boottime
ts=2024-07-02T14:06:34.527Z caller=node_exporter.go:118 level=info collector=cpu
ts=2024-07-02T14:06:34.527Z caller=node_exporter.go:118 level=info collector=diskstats
ts=2024-07-02T14:06:34.527Z caller=node_exporter.go:118 level=info collector=filesystem
ts=2024-07-02T14:06:34.527Z caller=node_exporter.go:118 level=info collector=loadavg
ts=2024-07-02T14:06:34.527Z caller=node_exporter.go:118 level=info collector=meminfo
ts=2024-07-02T14:06:34.527Z caller=node_exporter.go:118 level=info collector=netdev
ts=2024-07-02T14:06:34.527Z caller=node_exporter.go:118 level=info collector=os
ts=2024-07-02T14:06:34.527Z caller=node_exporter.go:118 level=info collector=powersupplyclass
ts=2024-07-02T14:06:34.527Z caller=node_exporter.go:118 level=info collector=textfile
ts=2024-07-02T14:06:34.527Z caller=node_exporter.go:118 level=info collector=thermal
ts=2024-07-02T14:06:34.527Z caller=node_exporter.go:118 level=info collector=time
ts=2024-07-02T14:06:34.527Z caller=node_exporter.go:118 level=info collector=uname
ts=2024-07-02T14:06:34.528Z caller=tls_config.go:313 level=info msg="Listening on" address=[::]:9100
ts=2024-07-02T14:06:34.528Z caller=tls_config.go:316 level=info msg="TLS is disabled." http2=false address=[::]:9100
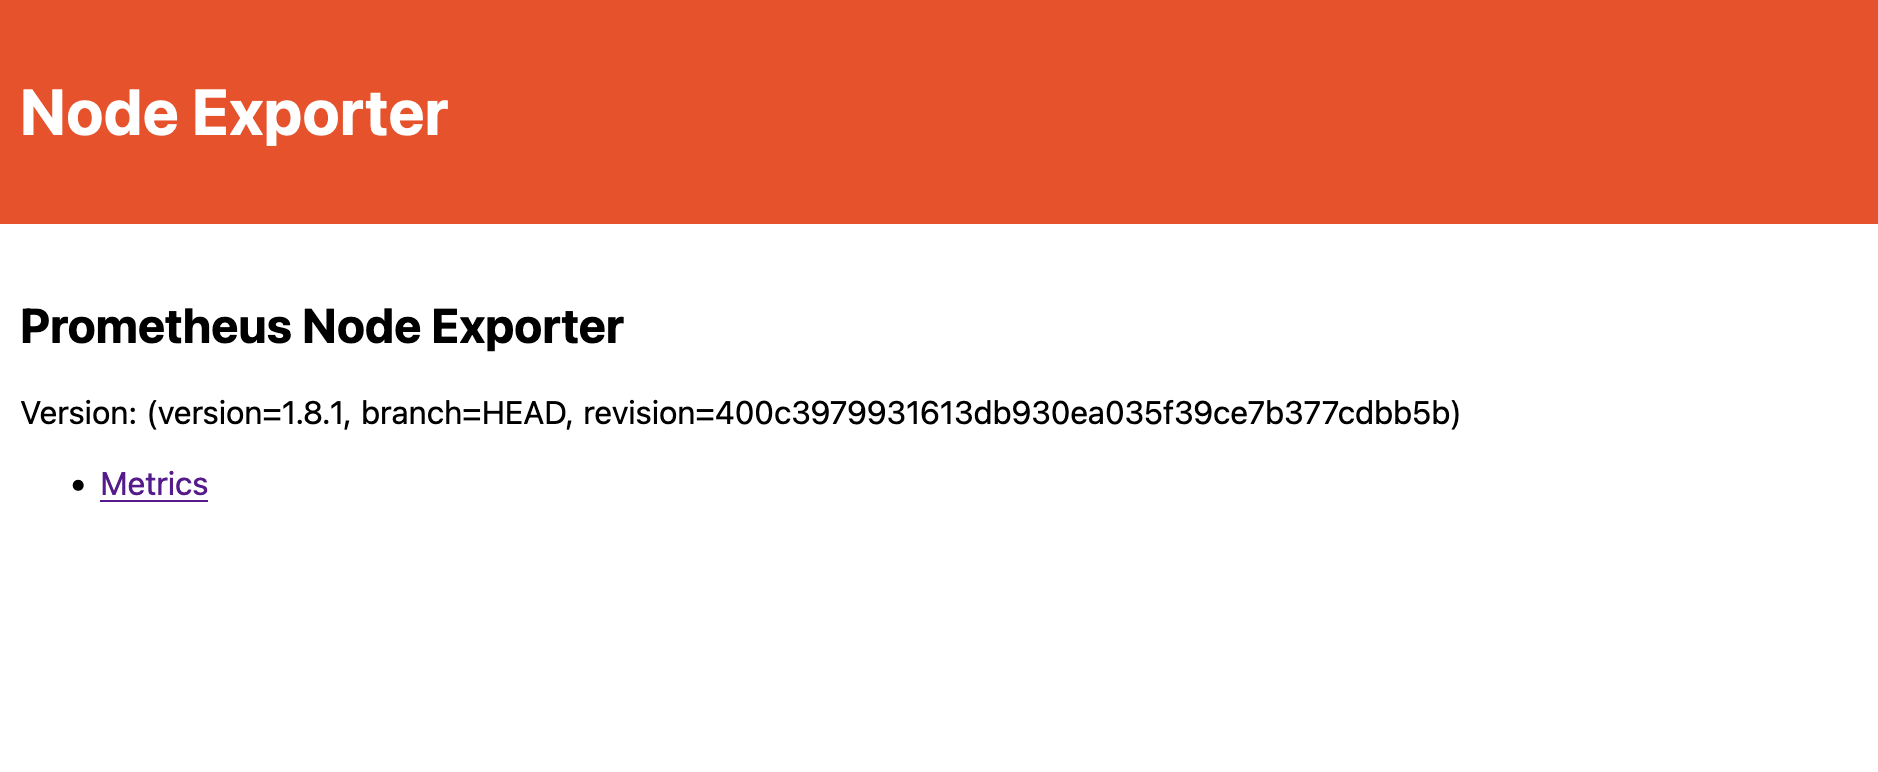
In my output it shows address=[::]:9100. It means that I can get the metrics
from node exporter at localhost:9100. When I open the address, it opens a
webpage.

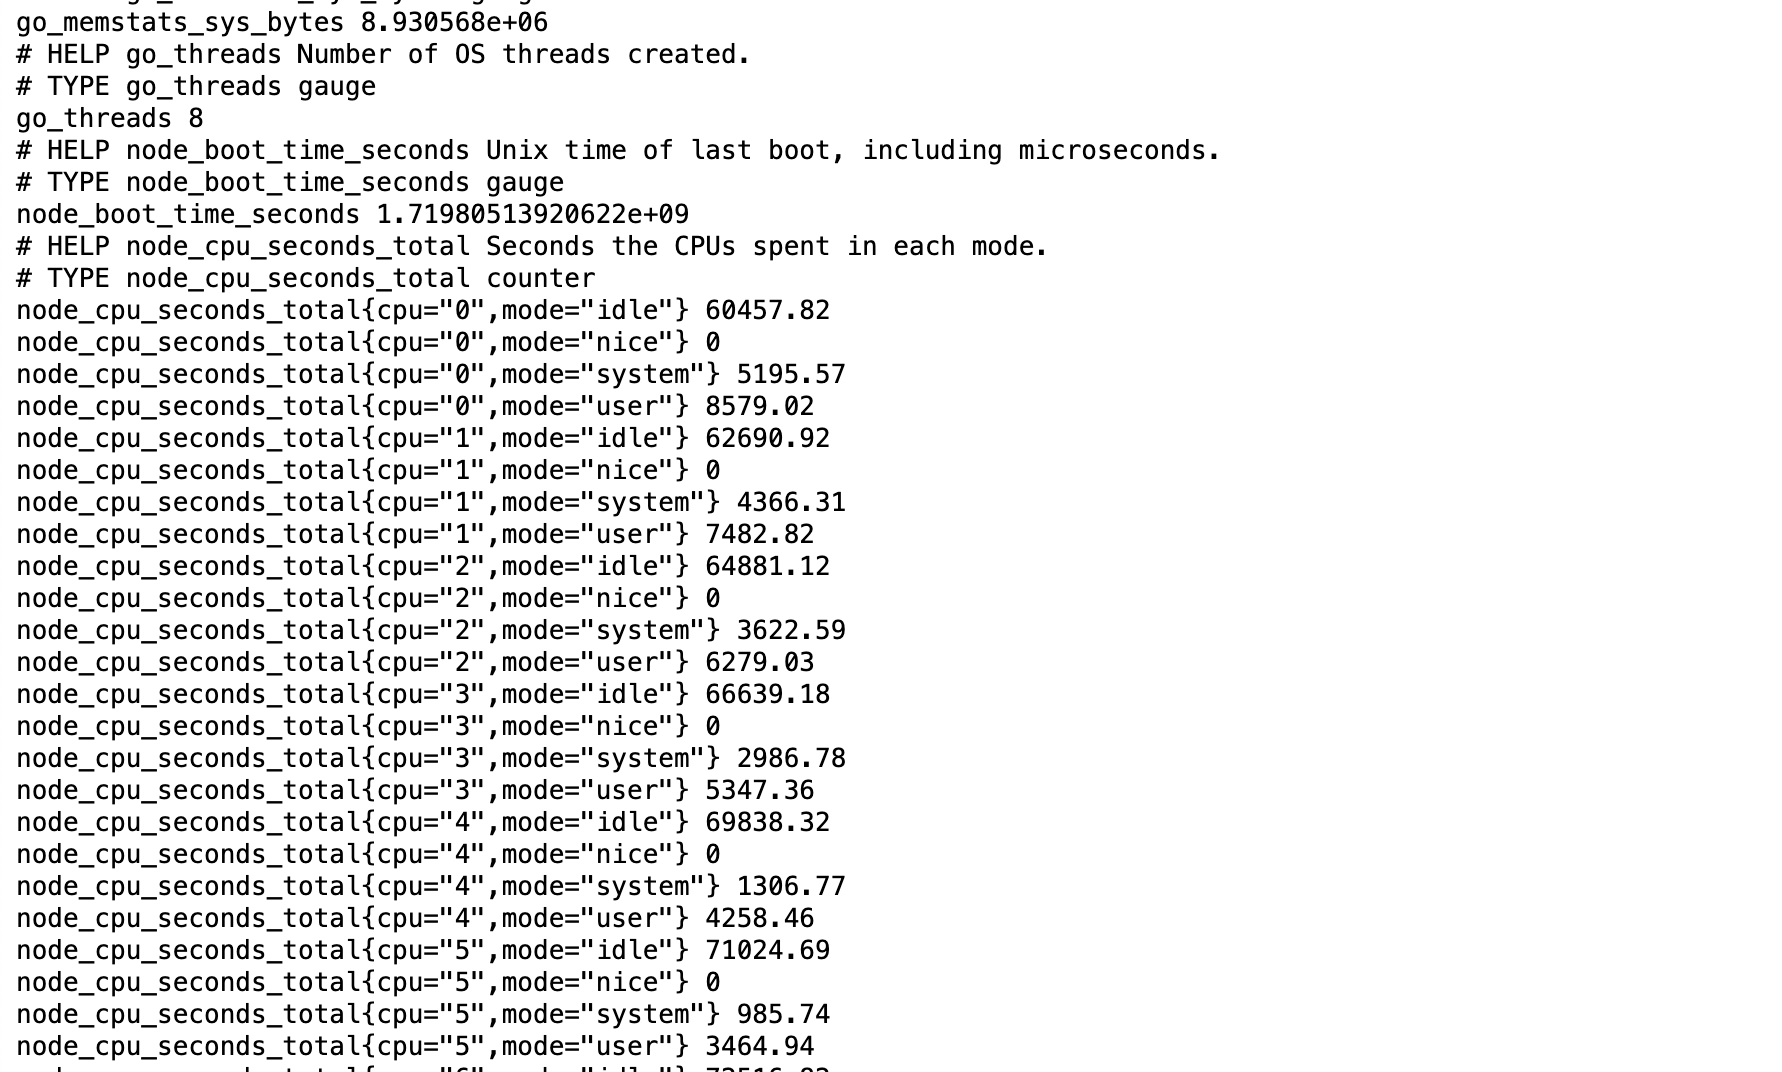
Click the Metrics link. It will shows the metrics exposed by node exporter.

Now it's time to scrape those metrics using prometheus. Change into the prometheus directory, created in the first post about prometheus. At the end of the config yaml file, add these lines:
  - job_name: "node_exporter"
    static_configs:
      - targets: ["localhost:9100"]
The whole config yaml file now should have the following content.
global:
  scrape_interval: 15s
  evaluation_interval: 15s

alerting:
  alertmanagers:
    - static_configs:
        - targets:

rule_files:

scrape_configs:
  - job_name: "prome"
    static_configs:
      - targets: ["localhost:9090"]
  - job_name: "node_exporter"
    static_configs:
      - targets: ["localhost:9100"]
Run the prometheus.
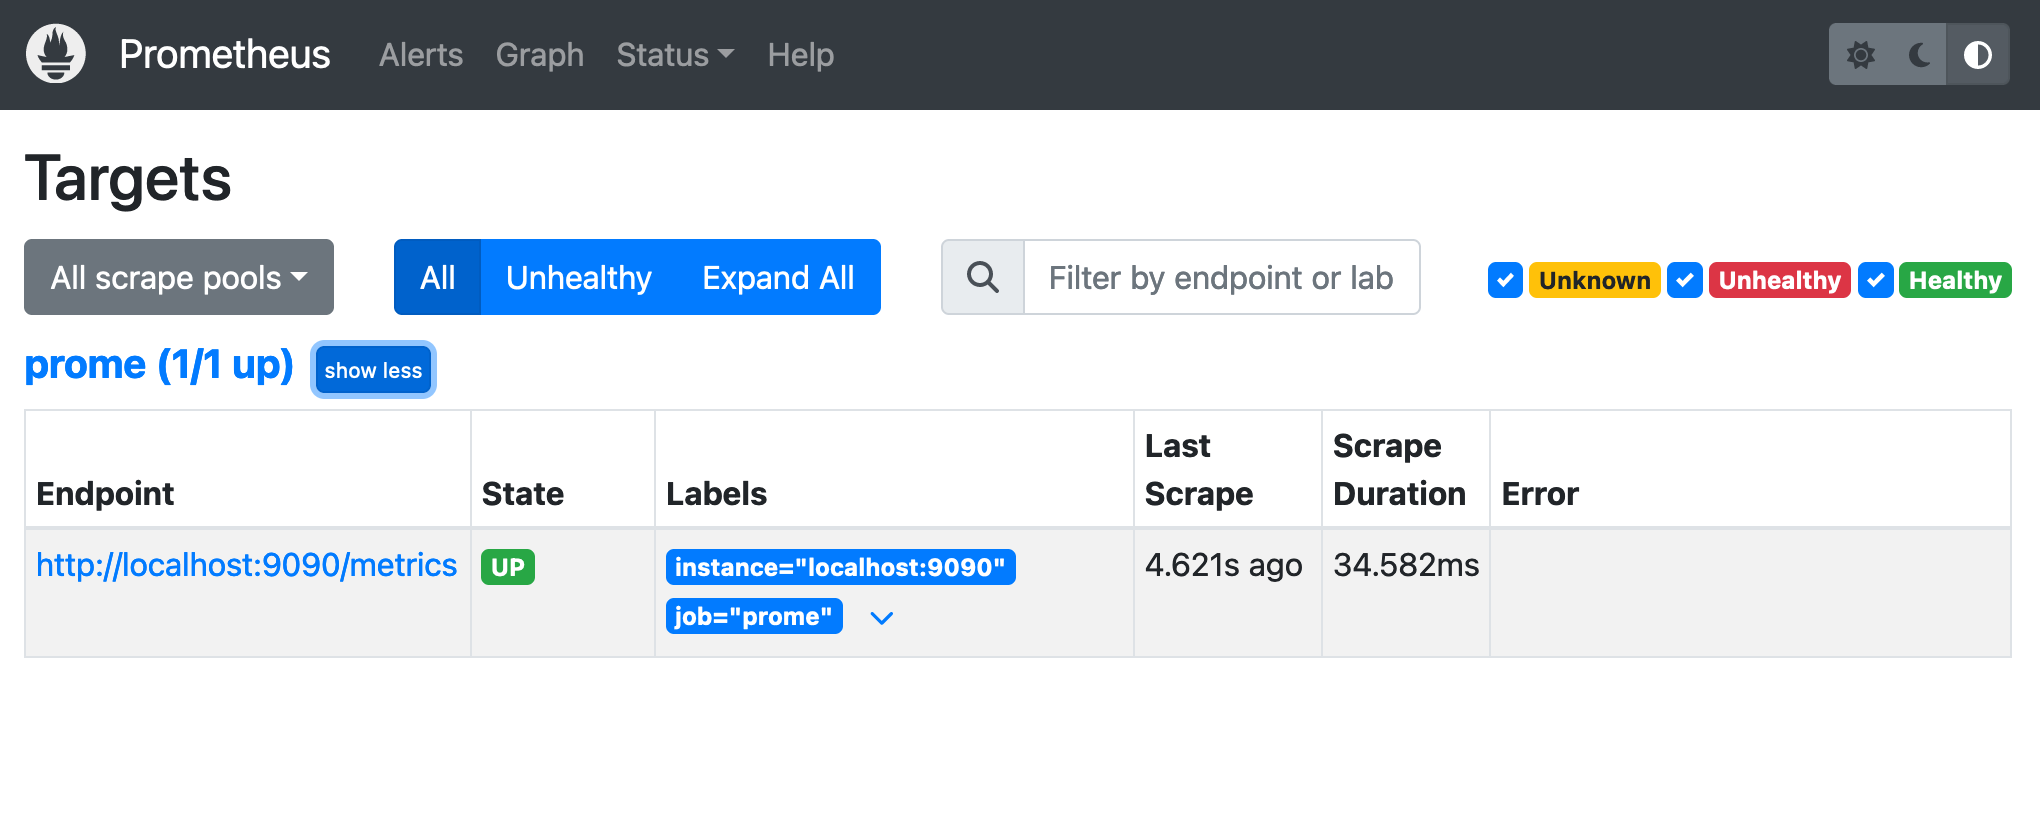
$ ./prometheus --config.file prometheus.ymlOpen the prometheus targets page at localhost:9090/targets. It should now show 2 targets.

With that you can query the metrics and graph them using the graph page in prometheus.
That's it for now. In the next post, we are going to use grafana to create dashboard for monitoring our machine.
- ← Previous
Prometheus' Metrics - Next →
Replacing brew with nix